Relaxometry
pyKNEEr computes:
Exponential or linear fitting [1,2]. Images with shortest TE or TSL can be rigidly registered to the image with longest TE or TSL
\(T_2\) maps from DESS acquisitions using Extended Phase Graph (EPG) modeling [3]
Exponential or linear fitting
Input: Image folder list
For the demo images, the input file is image_list_relaxometry_fitting.txt, which contains:
 [1] ./preprocessed
 [2] ./segmented
 [3] 4
 [4] i1 01_cubeQuant_01_orig.mha
 [5] i2 01_cubeQuant_02_orig.mha
 [6] i3 01_cubeQuant_03_orig.mha
 [7] i4 01_cubeQuant_04_orig.mha
 [8] bm 01_cubeQuant_01_prep_f.mha
 [9] cm 01_cubeQuant_01_prep_fc.mha
where:
Line 1: Preprocessed folder, containing the
*_orig.mhaimagesLine 2: Segmented folder, containing femur and cartilage masks
Line 3: Number of images per acquisition
Lines 4-7: Images of the acquisition
Line 8: Name of femur mask
Line 9: Name of femoral cartilage mask
Tip
When using your own data:
Customize
image_list_relaxometry_fitting.txtwith your own image information
Executing relaxometry_fitting.ipynb
To calculate relaxometry maps:
Launch Jupyter notebook
In File Browser, navigate to
relaxometry_fitting.ipynb, open it, and:Customize the input variables:
method_flag(1 for linear fitting, 0 for exponential fitting)registration_flag(1 to execute rigid registration, 0 otherwise)n_of_cores(How do I choose the number of cores?)output_file_name
Follow the instructions in the notebook
Save your notebook at the end of the process
Output: relaxometry maps
The outputs are in the folder relaxometry. For each subject, the fitting maps can be:
*_orig_map_exp_aligned.mha(e.g.01_cubeQuant_01_orig_map_exp_aligned.mha): when the acquisitions are rigidly aligned to the first and the fitting is exponential*_orig_map_lin_aligned.mha: when the acquisitions are rigidly aligned to the first and the fitting is linear*_orig_map_exp.mha: when the acquisitions are not aligned to the first and the fitting is exponential*_orig_map_lin.mha: when the acquisitions are not aligned to the first and the fitting is linear
Maps are computed only in the masked volumes to save computational time
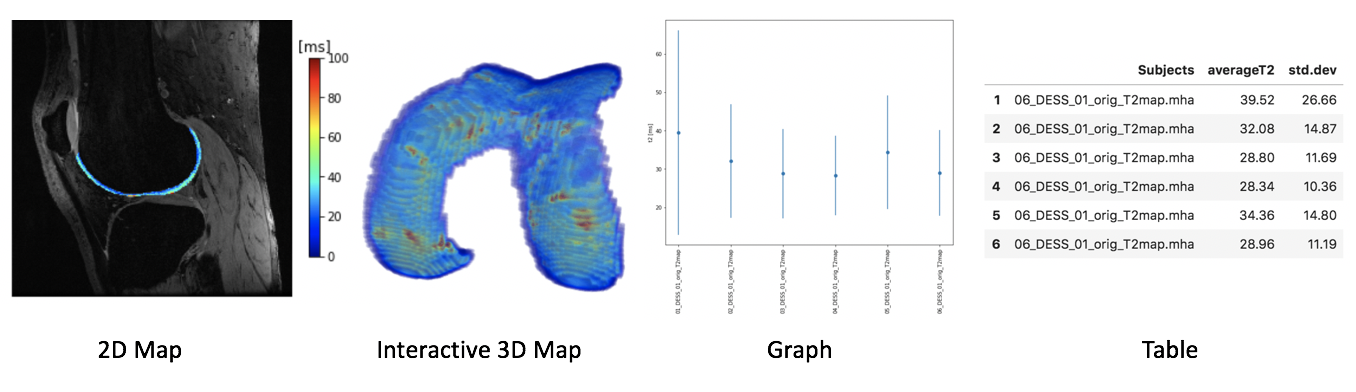
Visualization: 2D and 3D maps, graph, and table
Relaxometry maps are visualized as:
2D maps: For each subject three slices of the first acquisition are overlapped by the relaxation time map
3D maps: Interactive visualization where only one map at the time can be visualized
Graph: Dots represent the average relaxation time per image and bars represents the standard deviation
Table: Numerical values of average and standard deviation of relaxation times are displayed in a table, also saved as
.csvfile for subsequent analysis
EPG modeling
Input: Image folder list
For the demo images, the input file is image_list_relaxometry_EPG.txt, which contains:
 [1] ./preprocessed
 [2] ./segmented
 [3] i1 01_DESS_01_orig.mha
 [4] i2 01_DESS_02_orig.mha
 [5] cm 01_DESS_01_prep_fc.mha
where:
Line 1: Preprocessed folder, containing the
*_orig.mhaimagesLine 2: Segmented folder, containing cartilage masks
Lines 3-4: Images of the acquisition
Line 5: Name of femoral cartilage mask
Note
When using your own data:
Customize
image_list_relaxometry_EPG.txtwith your own image information
Execution, Output, and Visualization
Execution:
To calculate the map, apply the instructions above to the notebook
relaxometry_EPG.ipynb. In the notebook, customize the variables:number_of_cores(How do I choose the number of cores?)output_file_name
Output and visualization:
References
[1] Borthakur A., Wheaton A.J., Gougoutas A.J., Akella S.V., Regatte R.R., Charagundla S.R., Reddy R.
In vivo measurement of T1rho dispersion in the human brain at 1.5 tesla.
J Magn Reson Imaging. Apr;19(4):403-9. 2004.
[2] Li X., Benjamin Ma C., Link T.M., Castillo D.D., Blumenkrantz G., Lozano J., Carballido-Gamio J., Ries M., Majumdar S.
In vivo T1ρ and T2 mapping of articular cartilage in osteoarthritis of the knee using 3 T MRI.
Osteoarthritis Cartilage. Jul;15(7):789-97. 2007.
[3] Sveinsson B, Chaudhari AS, Gold GE, Hargreaves BA.
A simple analytic method for estimating T2 in the knee from DESS.
Magn Reson Imaging. May;38:63-70. 2017.